Radford University
Sustainability
A Core Value
of Radford University
We are committed to integrating sustainable practices into all aspects of our operations and engage students across the curriculum to learn, discover and contribute to positive current and future environmental solutions.
Why Does It Matter?
Living on a finite planet with limited resources and an ever-growing population forces us to think about best practices for sustaining life in the future. We often take for granted that we will have unlimited clean water and electricity, and these everyday necessities are becoming harder and harder to supply.
Learning to think and live consciously about our everyday lives, the resources we use, and how we can make smarter decisions is the first step for a sustainable future.
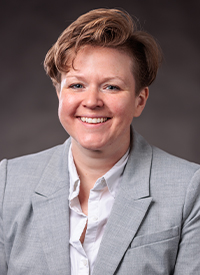
Aysha Bodenhamer, Ph.D.
Sustainability Manager
- Phone:
- 540-831-5067
- Email:
- abodenham3@radford.edu
Sustainability in the News
-
The Association for the Advancement of Sustainability in Higher Education has commended Radford University for completing the organization’s STARS rating system.
-
Thirteen Radford students and four faculty members set out for eastern Kentucky to plant 1,200 trees as part of the recurring Alternative Spring Break trip.
-
Radford University part of collaboration receiving USDA grant for produce prescription program
December 17, 2024
A regional collaboration that includes Radford University’s Department of Public Health and Healthcare Leadership is receiving nearly $480,000 in federal funding to encourage fruit and vegetable consumption among Medicaid patients for better food security and health outcomes.

-
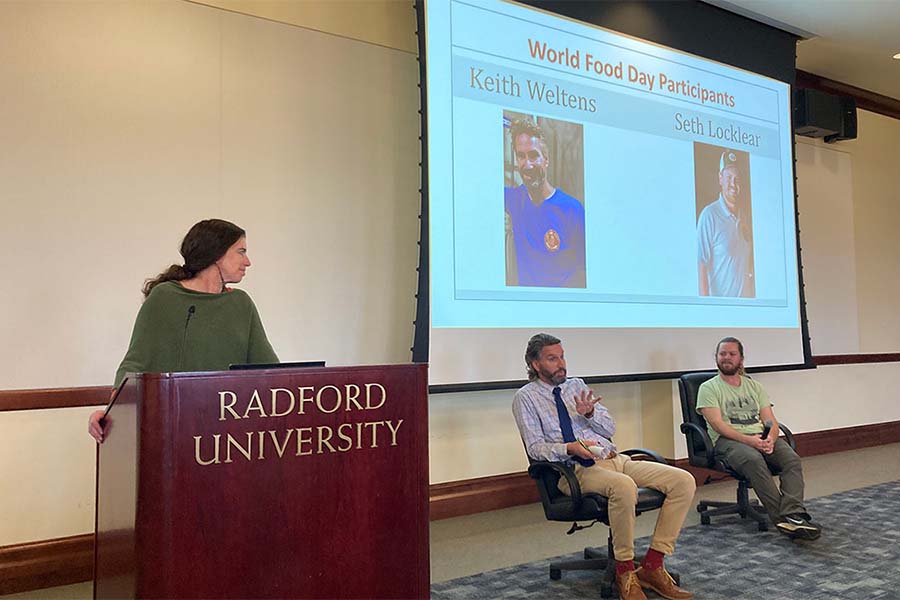
Students marking World Food Day learned how local businesses can extend international reach
October 30, 2024
The annual forum, held Oct. 16 at Kyle Hall, welcomed New River Valley business owners, including Bukola “Bookie” Fabiyi, a healthcare professional who runs the company We Live and Eat Well, and Max Scheutz, who co-owns and operates Blacksburg’s Oasis World Market.
-
Radford tops in Virginia colleges and universities in LEED square-footage percentage
October 8, 2024
Radford University has the highest percentage of LEED certified campus building square footage of any private or public college or university in Virginia.
-
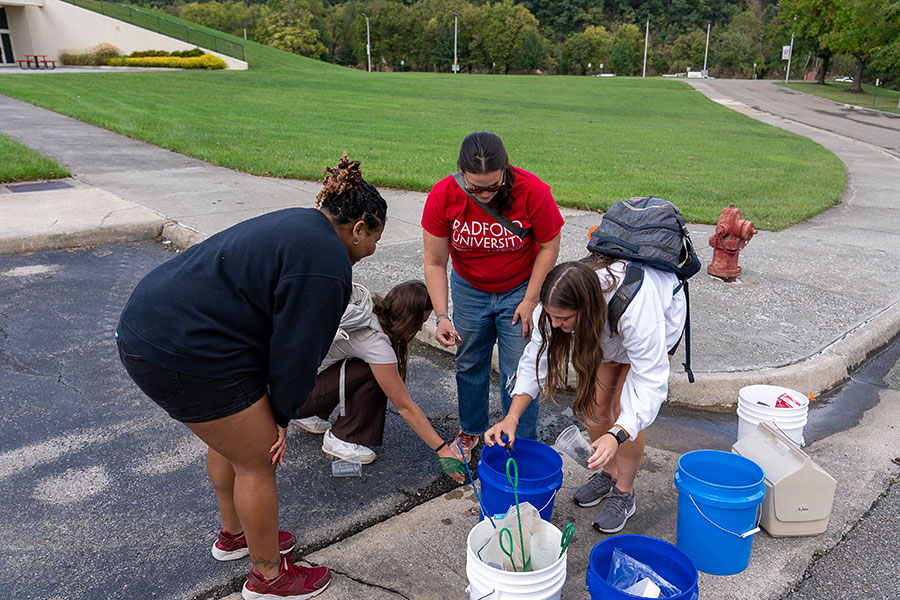
Days after flooding from remnants of Hurricane Helene, Professor of Biology Sara O’Brien's lab students sampled displaced crawfish for hormones and microplastics.
-
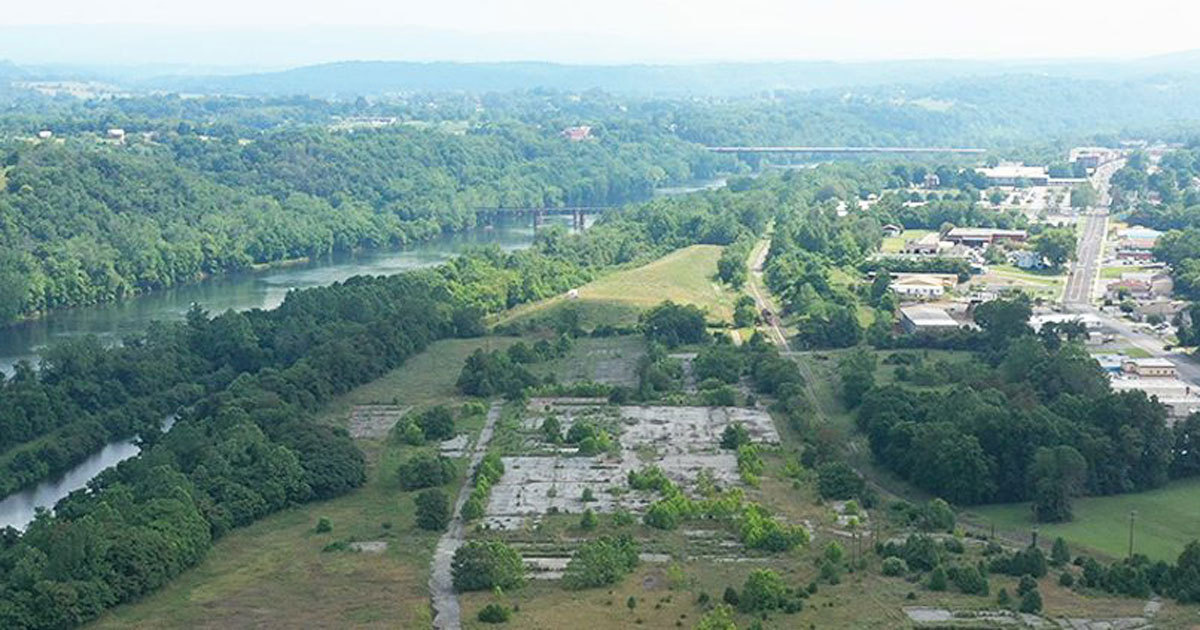
University-City partnership awarded ARC grant to support former foundry site redevelopment efforts
September 19, 2024
A grant awarded to Radford University enables students to lead two interdisciplinary research projects this fall.
-
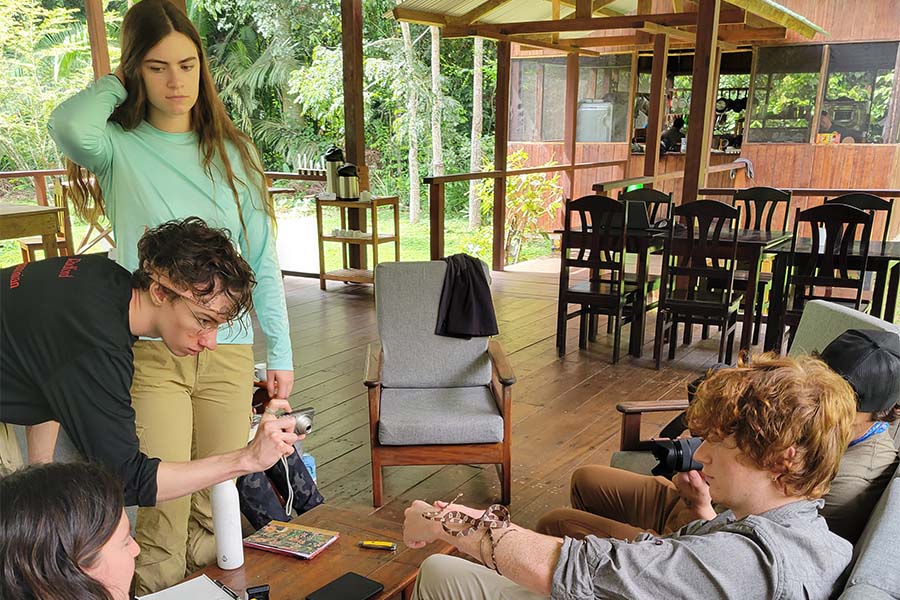
The trip ran from May 15 to June 5 with stops at Puerto Maldonado and the Las Piedras Biodiversity Station, situated within more than 30,000 acres of rainforest.
-
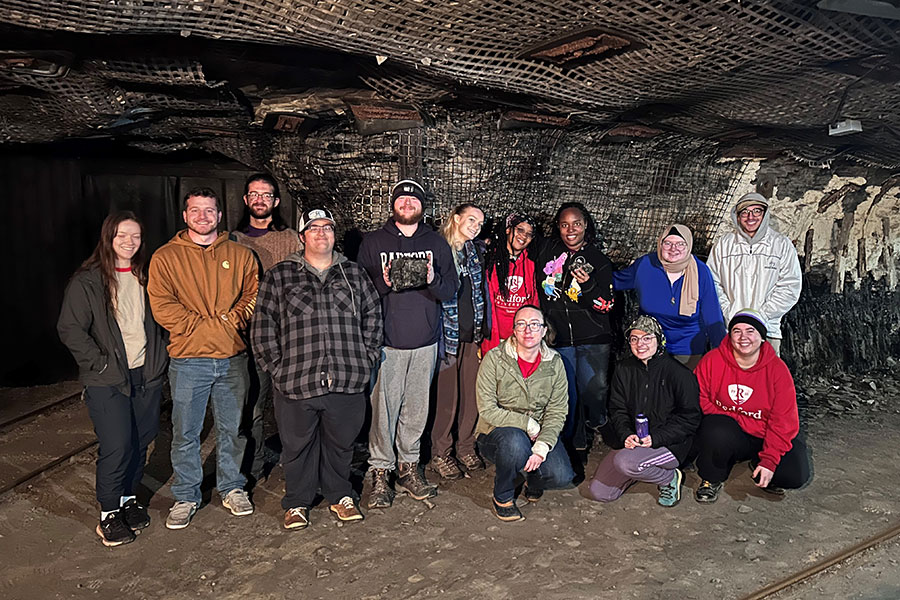
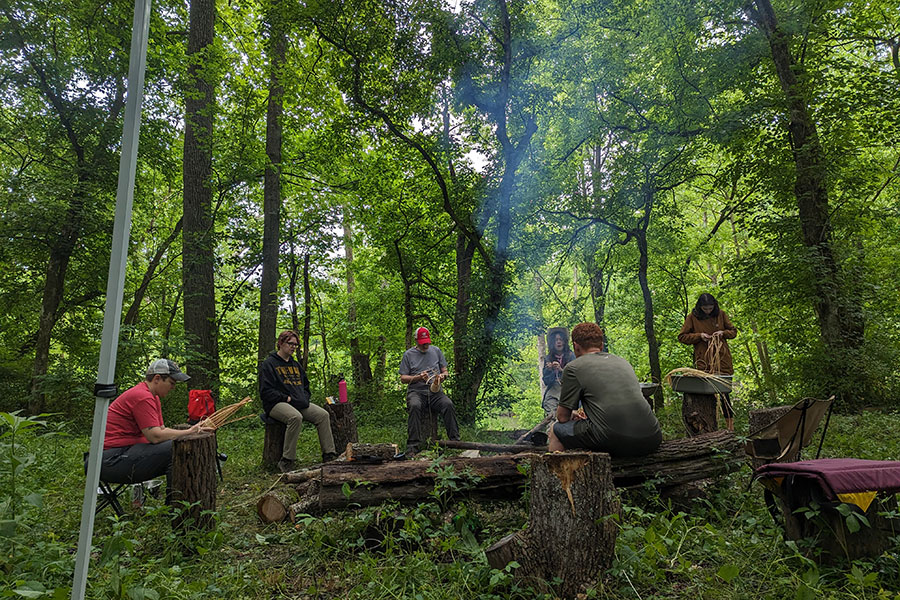
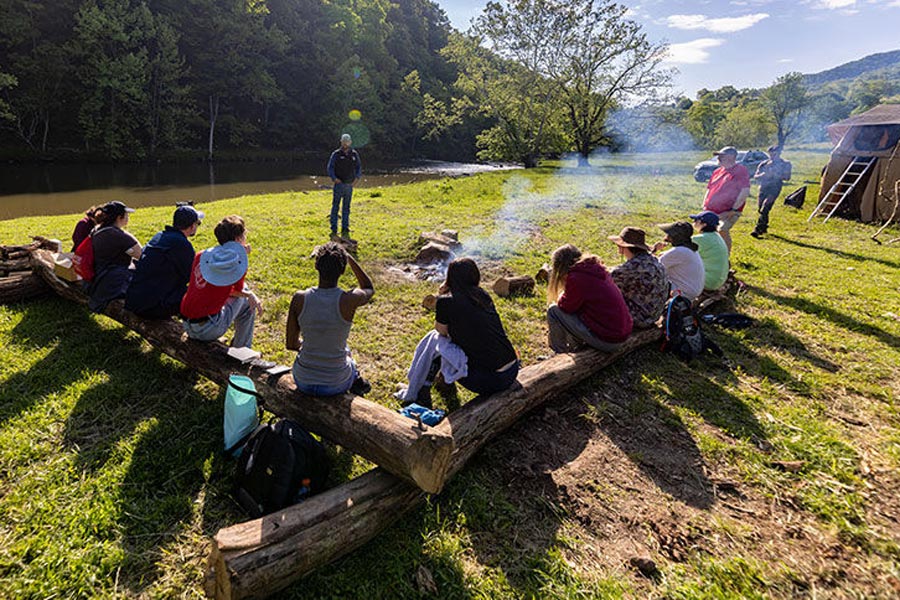
Students explore Southwest Virginia on RARE Appalachia trip.
-
This month, a group of intellectually curious Radford University students will embark on a two-week trek exploring remote areas tucked away in Southwest Virginia’s Appalachian Highlands.
-
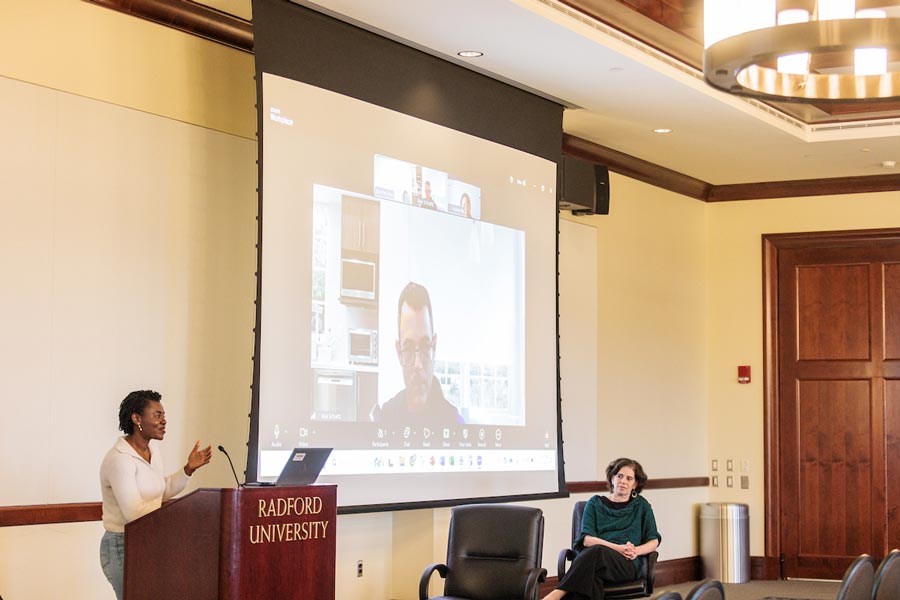
Q&A with Sustainability Manager Aysha Bodenhamer
May 6, 2024
Aysha Bodenhamer ’10, a Radford alumna and Sociology faculty member, became Radford’s sustainability manager this year to promote a culture of sustainability.

-
Business students get firsthand advice from local entrepreneurs
October 30, 2023
The co-owners of Radford and Christiansburg breweries were on campus Oct. 16 for the annual World Food Day Lecture Symposium on the theme “Water is Life, Water is Food."