|
|
|
|
|
|
|
|
|
|
![]()
Satellites: NOAA-15 and NOAA-17, part of NOAA's 850km-high (530 mile-high) Polar Orbiting satellites
Cold front comin' through!
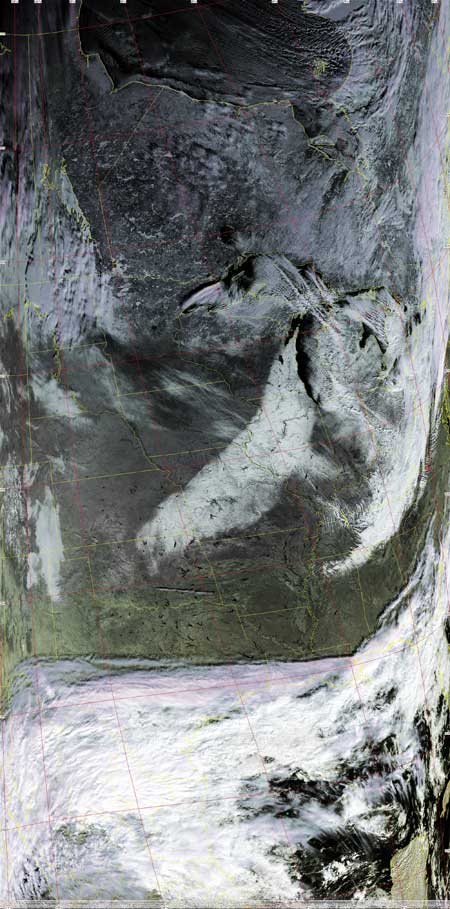
The two images below show the class case
of a cold front moving through the southeast.
In the left hand image, there is a band of cool clear air being pushed
along
from Alabama up through Virginia. It is being pushed by the very cold air
behind it (to the northwest).
This band is clear of clouds, but is pushing a band of clouds ahead of it, to
the southeast of that clear band.
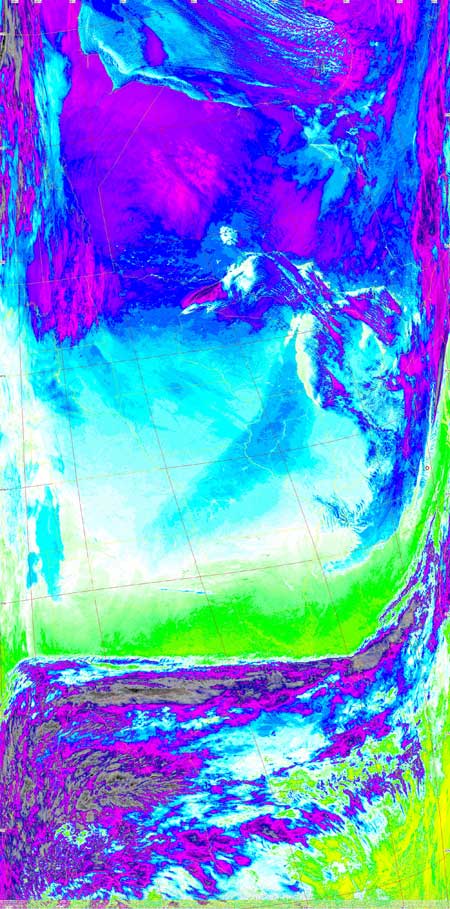
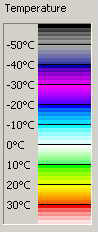
The right-hand image is a thermal scan
showing how that clear area is very cold air.
Where the cool air of
this clear band contacts the warmer, wetter air in front of it, clouds
form.
Notice there is a second band of clouds behind (northwest of)
that clear air. Those clouds are right behind that very cold air.
These are high, thin cirrus clouds. These clouds have been pushed up so
high because the cold air is very dense, and has sunk.
The warm,
wetter air is less dense and has been pushed upwards because of the
dense, low-lying cold air.
This whole system is a result of the
larger, low-pressure system at the northeast corner of both images.
These low-pressure systems rotate counterclockwise in the northern
hemisphere.
Using the weather station data above, you should be able to follow with just the data when these cold/dry and warm/wet air bands pass through our area.
 |
  |