|
|
|
|
|
|
|
|
|
The link above takes you to the
Weather Underground's
Radford University page that shows our weather data, updated every
5 minutes. There, you can also find the data archived in text
format.
|
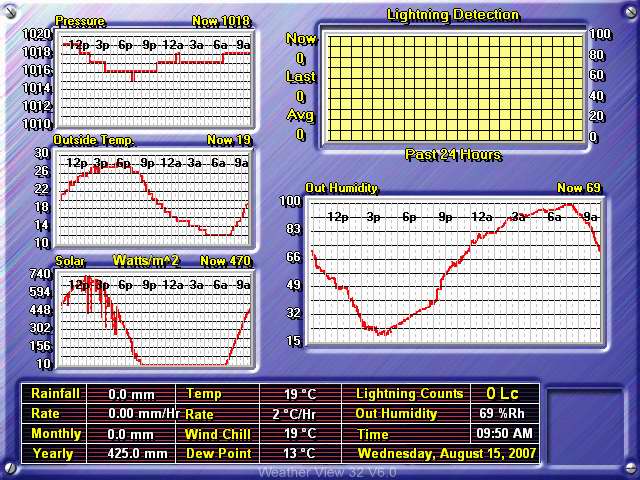
The image below is a live weather readout from the
Texas Weather Instruments
WRL-32S weather station located on the top of Curie Hall.
|
Satellites: NOAA-15
and NOAA-17,
part of NOAA's 850km-high (530 mile-high) Polar
Orbiting satellites
The Strange Evolution of Ophelia
Ophelia started out as a tropical storm that seemed like it would
fizzle out.
However, by late Thursday, Ophelia had gathered her strength and consolidated
her clouds, becoming a full-blown hurricane.
Ophelia also took a very unusual track, first flirting with turning northeast
(out to sea) but then turning back towards land by Monday afternoon.
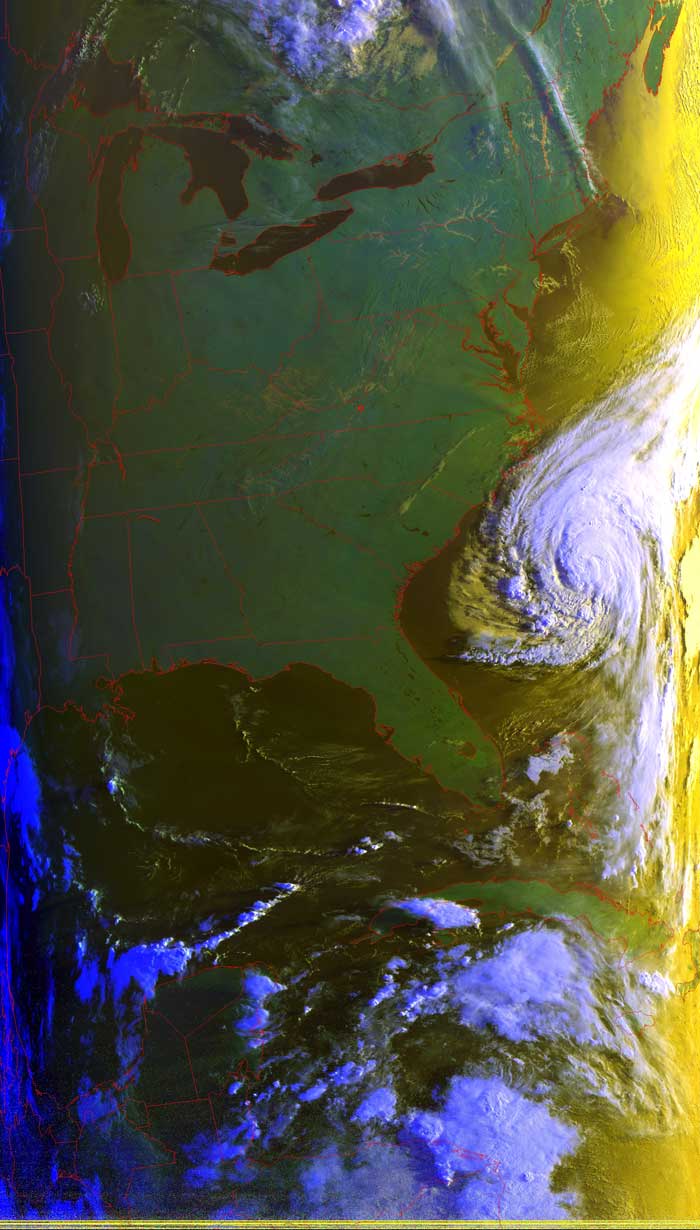
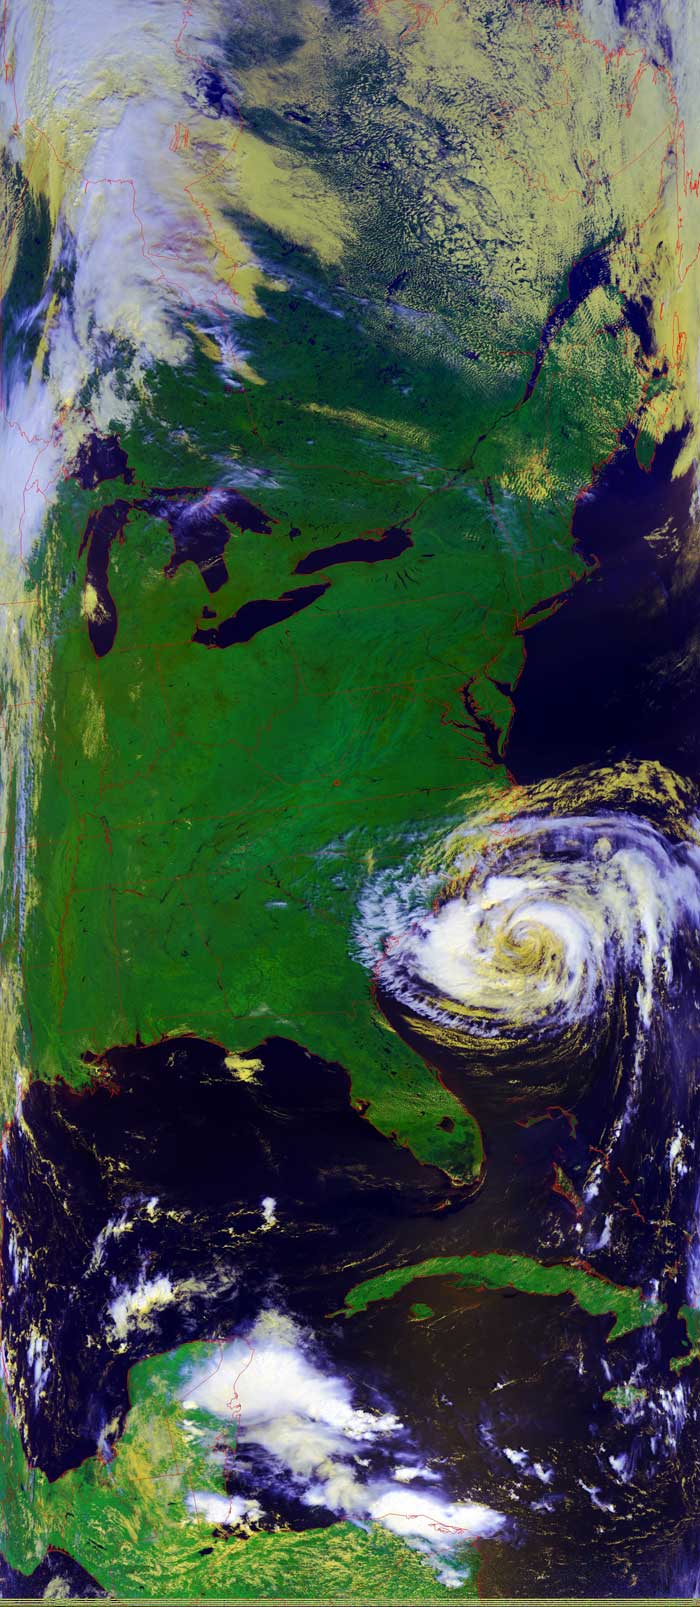
All of the images below are "rgb" images.
This means that the various wavelengths of the satellite images are combined to
bring out features such as the two-layer structure of Ophelia's clouds:
High/cold clouds are white while lower/warmer clouds are more yellow.
Click on the image(s) below for a higher-resolution (~100k) picture.
|
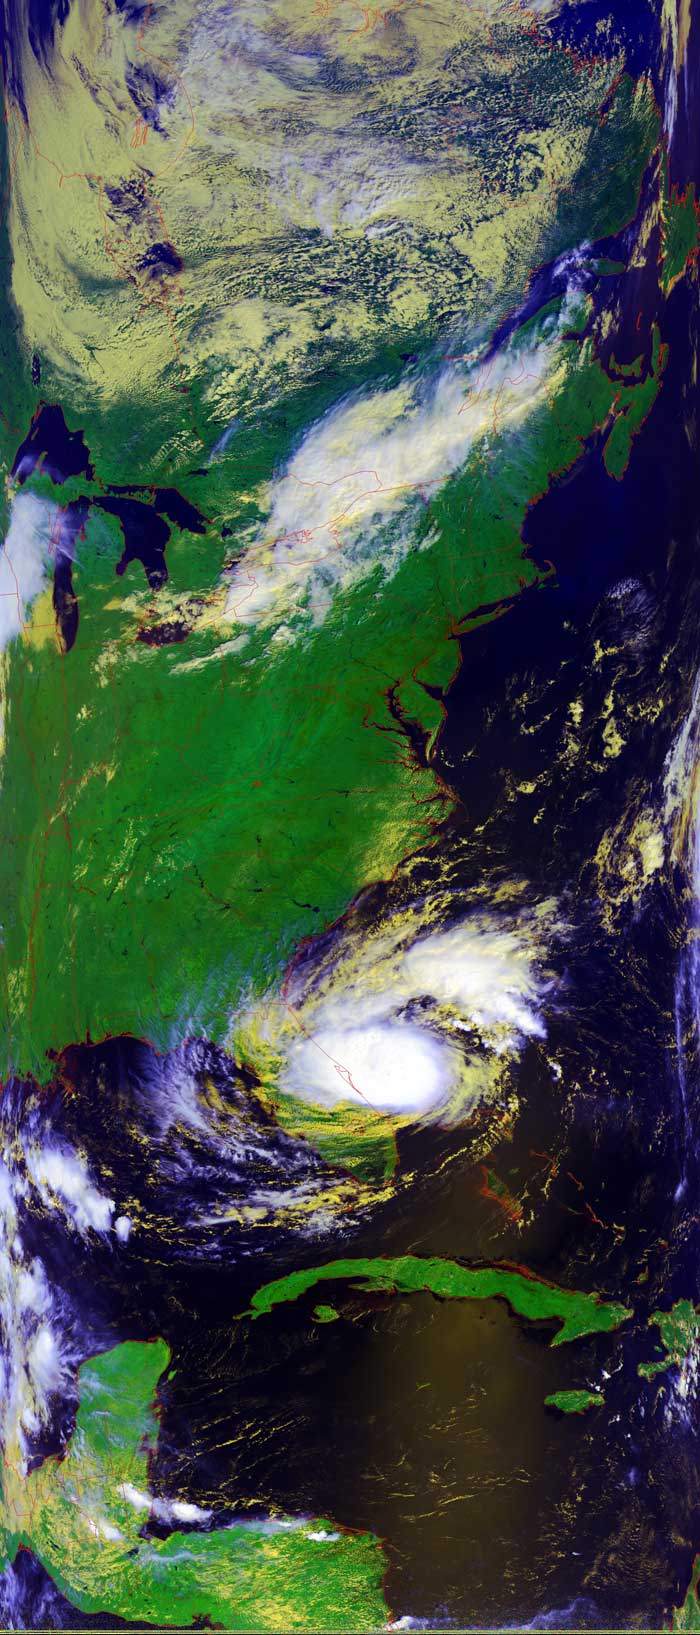
Thursday, Sept. 8 Tropical Storm Ophelia early in the day, Hurricane Ophelia late in the day |
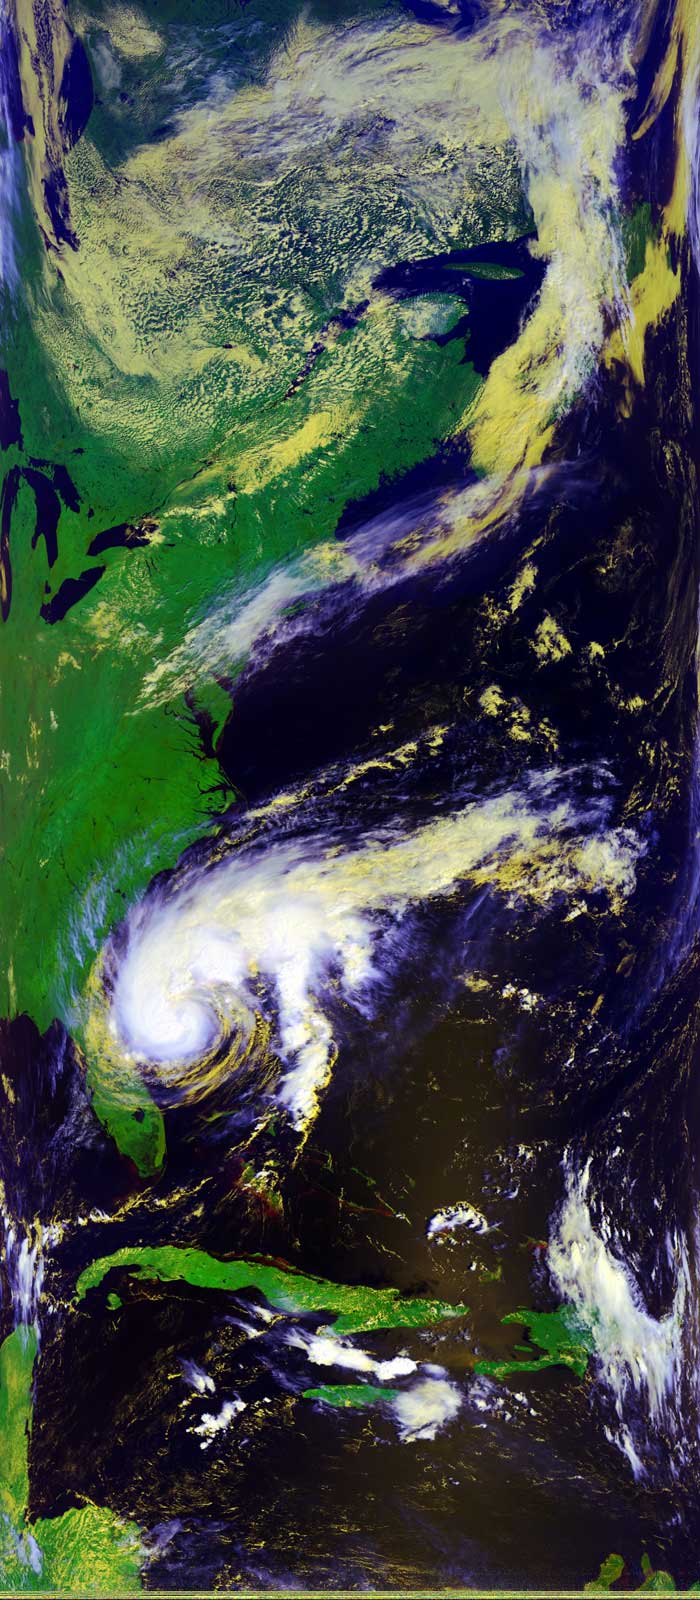
Friday, Sept. 9 Hurricane Ophelia stalls off of the coast of Florida |
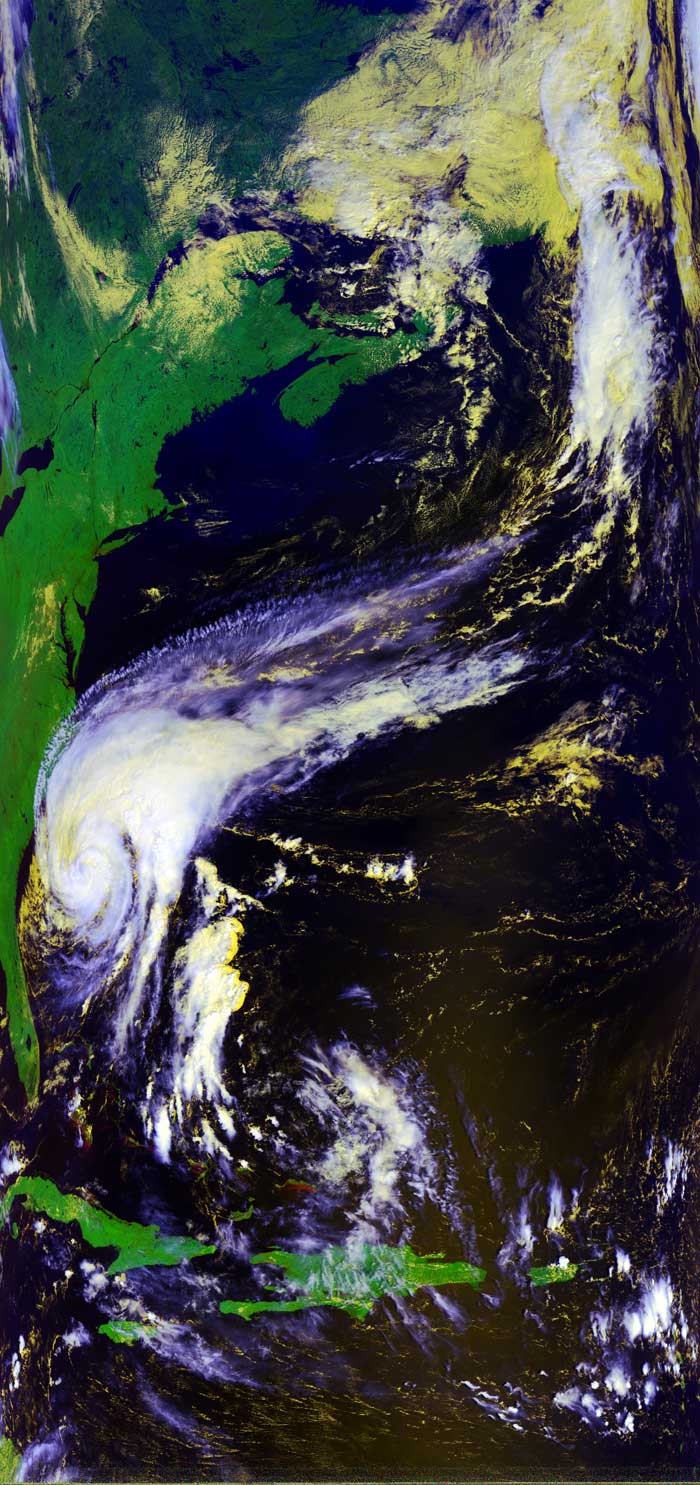
Saturday, Sept. 10 Hurricane Ophelia slowly heads north, teasing the southeastern coast |
Sunday, Sept. 11 Early morning shadows reveal Hurricane Ophelia still moving northeastward |
Monday, Sept. 12 Hurricane Ophelia turns w4estward towards the Carolinas' coasts |
 |
 |
 |
 |
 |