| First Set of measures | Second Set of measures |
| 2.0 1.0 3.0 5.0 2.0 7.0 2.0 9.0 6.0 3.0 | 3.5 5.0 3.5 6.0 3.5 5.0 5.5 3.0 2.5 2.5 |
| Sample sum = 40.0 | Sample sum = 40.0 |
| Sample mean = 4.0 | Sample mean = 4.0 |
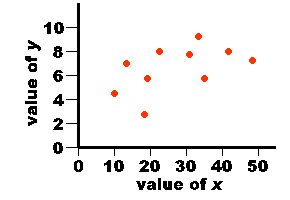
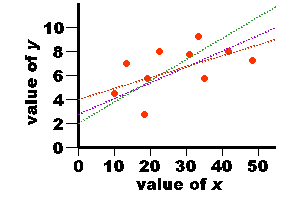
| value of x | value of y |
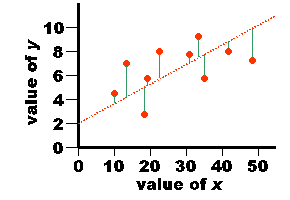
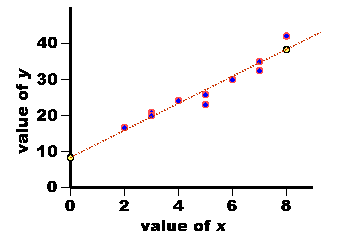
| 3.0 5.0 3.0 7.0 5.0 8.0 7.0 4.0 6.0 2.0 | 21.0 26.0 20.0 32.0 23.0 42.0 35.0 24.0 30.0 17.0 |
| Sum = 50.0 | Sum = 270.0 |
| Mean = 5.0 | Mean = 27.0 |
| Varx = 4.0 | Vary = 59.3 |
| sx = 2.0 | sy = 7.7 |
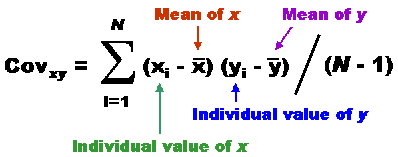
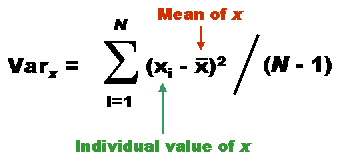
| value of x | xi - mean x | value of y | yi - mean y | xi - mean x x yi - mean y |
| 3.0 5.0 3.0 7.0 5.0 8.0 7.0 4.0 6.0 2.0 | -2.0 0.0 -2.0 2.0 0.0 3.0 2.0 -1.0 1.0 -3.0 | 21.0 26.0 20.0 32.0 23.0 42.0 35.0 24.0 30.0 17.0 | -6.0 -1.0 -7.0 5.0 -4.0 15.0 8.0 -3.0 3.0 -10.0 | 12.0 0.0 14.0 10.0 0.0 45.0 16.0 3.0 3.0 30.0 |
| Sum = 50.0 | . | Sum = 270.0 | . | Sum = 133.0 |
| Mean = 5.0 | . | Mean = 27.0 | . | . |
| Varx = 4.0 | . | Vary = 59.3 | . | Covxy = 14.8 |
| sx = 2.0 | . | sy = 7.7 | . | . |
| City | Population Size in thousands (x) | Cost of Eggs (y) |
| Boston | 1004 | $58.43 |
| Chicago | 1543 | $64.12 |
| Des Moines | 4012 | $200.14 |
| Frankfort | 589 | $30.15 |
| New York City | 9050 | $455.68 |
| San Francisco | 8054 | $389.39 |
| Toledo | 7837 | $255.71 |
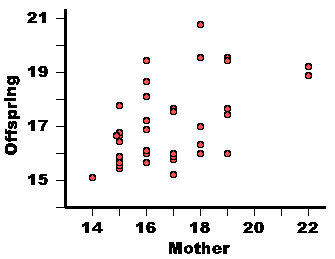
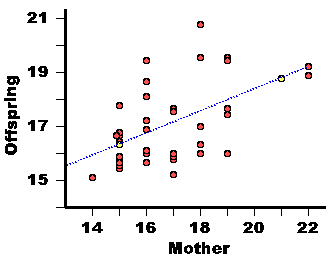
| Mother | Offspring Mean |
|
17 16 22 17 15 15 16 15 16 17 15 18 18 22 15 19 15 14 16 17 15 15 17 17 16 19 19 19 16 16 18 16 18 15 15 15 18 19 |
17.7 16.0 19.2 15.2 17.8 16.7 19.4 15.8 17.2 15.8 16.4 17.0 19.5 18.9 15.5 17.6 15.9 15.1 18.1 17.6 15.5 16.4 15.8 16.0 15.6 19.5 19.5 16.0 16.9 16.0 16.1 18.6 16.3 16.6 15.6 16.7 20.8 17.4 |