Solve ![]()
![]() graphically.
graphically.
Solution: Let ![]()
![]() and
and ![]()
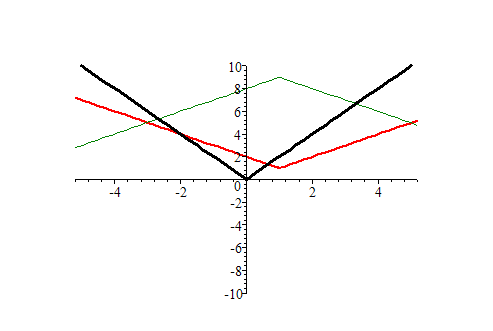
![]() Consider the graphs of
Consider the graphs of ![]()
![]() and
and ![]()
![]() as follows: Notice that
as follows: Notice that ![]()
![]() is drawn in black and
is drawn in black and ![]()
![]() is drawn in green. We are looking for interval(s)
where
is drawn in green. We are looking for interval(s)
where ![]()
![]() We can see that there are two intersections which
will give us the intervals we need. We are looking for the following
intersections:
We can see that there are two intersections which
will give us the intervals we need. We are looking for the following
intersections: ![]()
![]() and
and ![]()
![]() It is easy to find these two intersections to
be
It is easy to find these two intersections to
be ![]()
![]() and
and ![]()
![]() respectively and the answer for
respectively and the answer for ![]()
![]() is when
is when ![]()
![]()
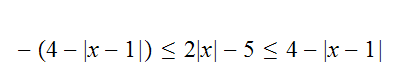
Solve ![]()
![]() graphically.
graphically.
Solution: First we rewrite the inequality as follows:
or
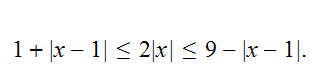
Now we define ![]()
![]() and
and ![]()
![]() and use the graphical approach we described above
to find the interval(s) for which
and use the graphical approach we described above
to find the interval(s) for which ![]()
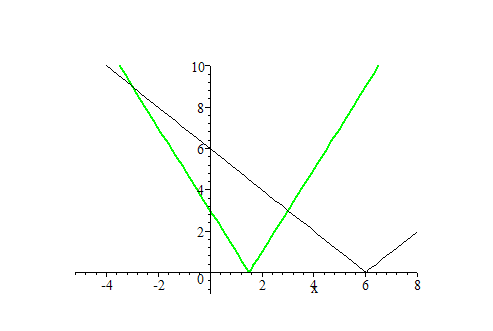
![]() We consider the graphs of
We consider the graphs of ![]()
![]() (black),
(black), ![]()
![]() (green) and
(green) and ![]()
![]() (red) as follows: (Notice that these are basic
graphs, which one can figure out easily by hand.) We leave the readers
to find appropriate intersections by hand. The answer is
(red) as follows: (Notice that these are basic
graphs, which one can figure out easily by hand.) We leave the readers
to find appropriate intersections by hand. The answer is
![]()
![]()