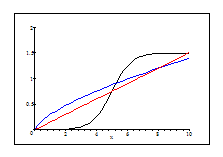
We have three ice skaters represented by the following graphs, skaters A, B, C
are represented by black, blue and red respectively. If the
 represents time in seconds, and the
 represents distance in meters. Interpret the graphs with your own
words, for example, who is running faster and etc.

Example: If the graphs above representing three cars start from rest at a traffic light and accelerate for several minutes, then which car is ahead? Explain.


