|
|
|
|
|
|
|
|
|
The link above takes you to the
Weather Underground's
Radford University page that shows our weather data, updated every
5 minutes. There, you can also find the data archived in text
format.
|
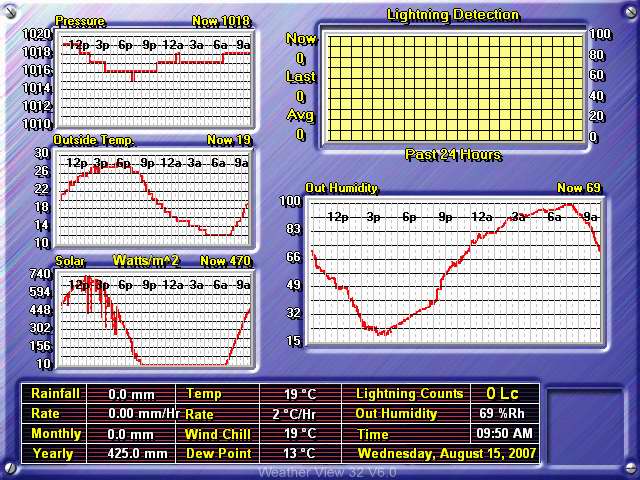
The image below is a live weather readout from the
Texas Weather Instruments
WRL-32S weather station located on the top of Curie Hall.
|
Satellites: NOAA-15
and NOAA-17,
part of NOAA's 850km-high (530 mile-high) Polar
Orbiting satellites
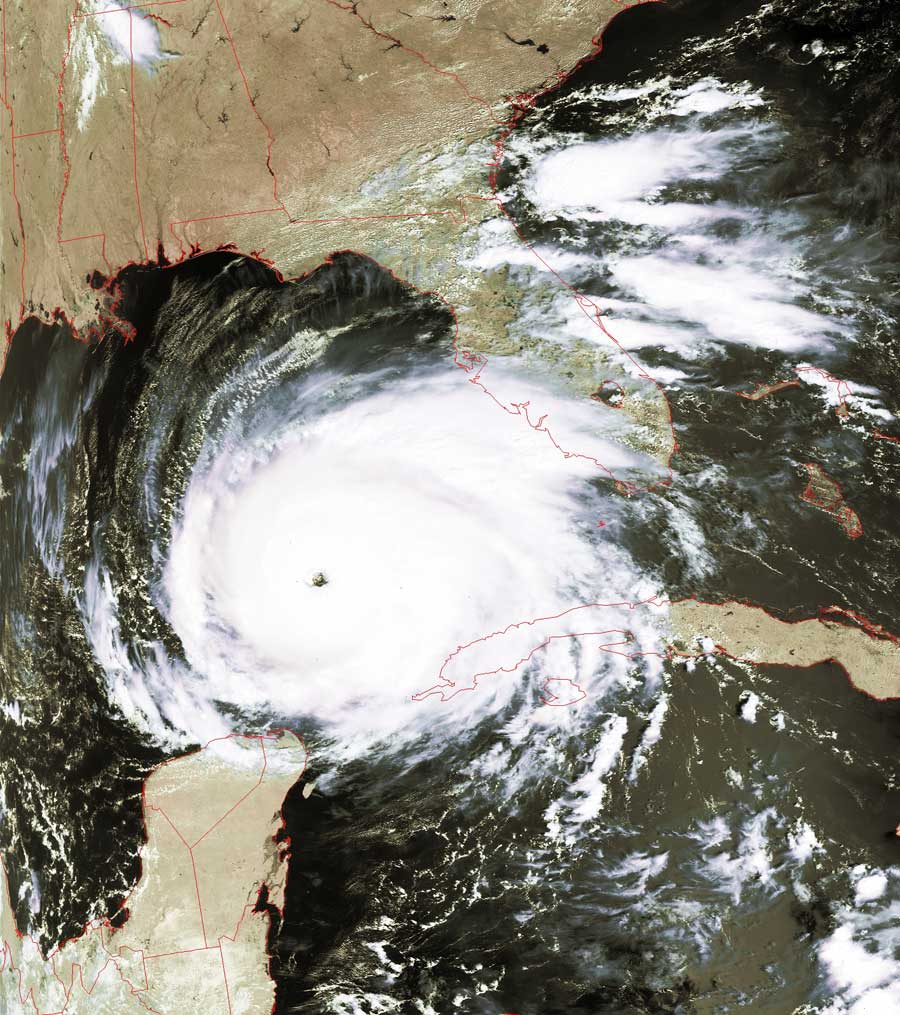
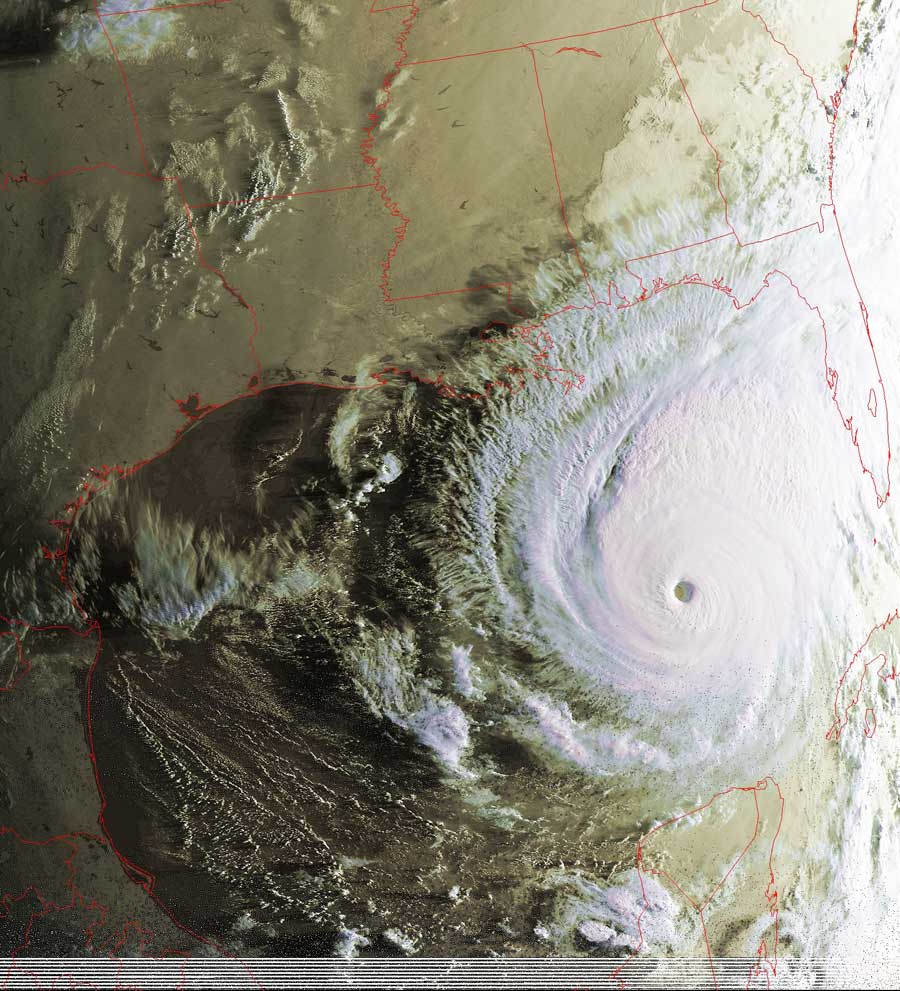
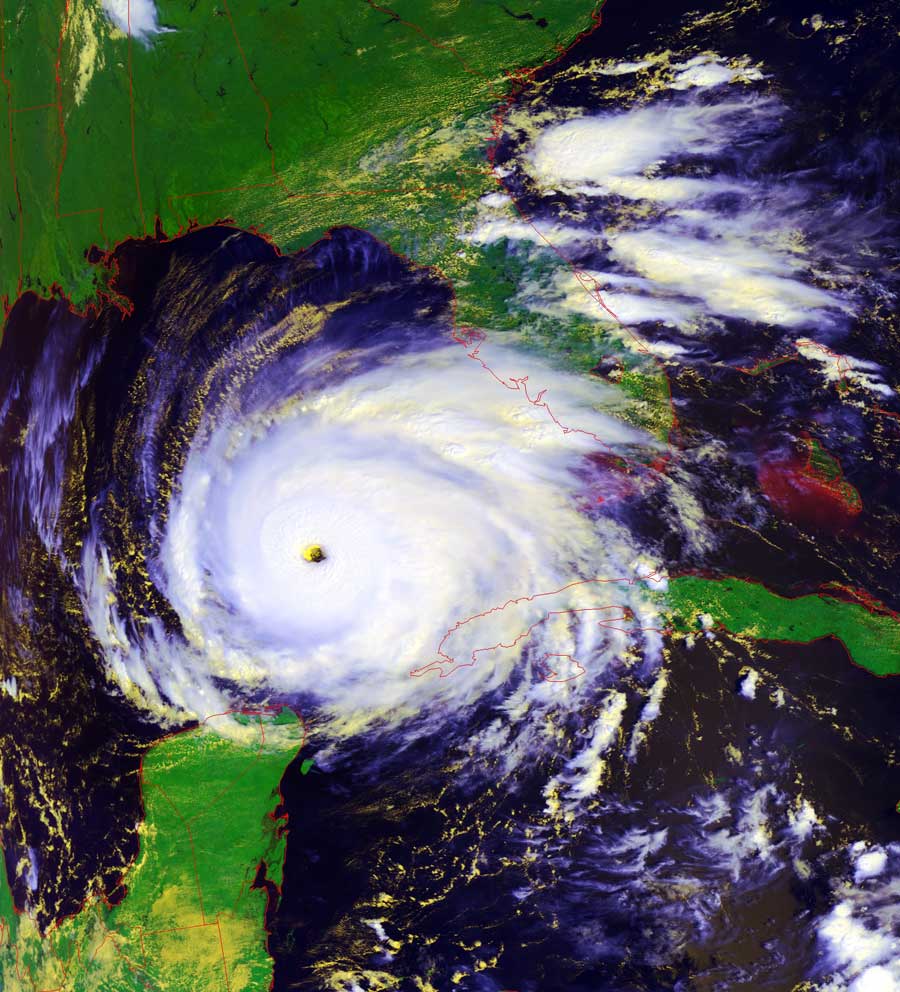
Rita, Part II: Evolution From Category 2 to Category 5 in one Day
The images below show the strikingly-quick evolution of Rita from a
category 2 to a category 5 hurricane.
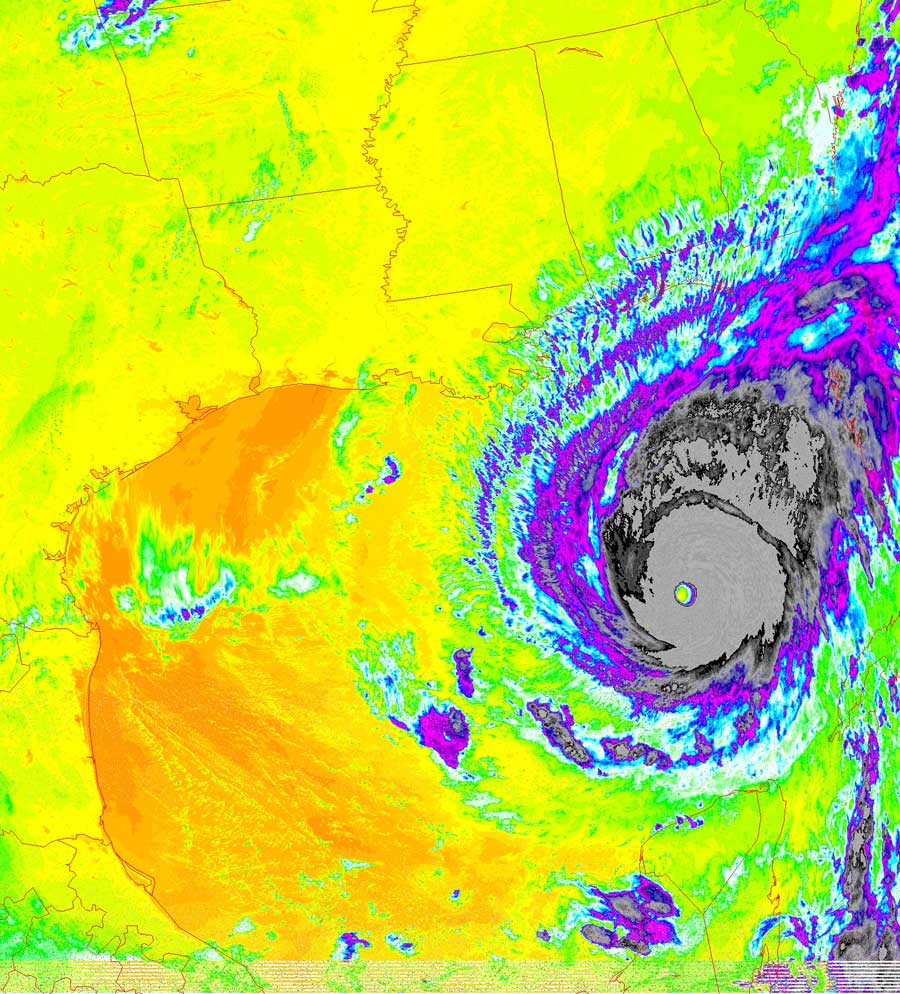
Hurricanes draw their remarkable power from evaporation of warm waters below
them.
Using some basic physics for the heating up of water (Q=mcDT)
and then its evaporation (Q=mLvaporization), one can estimate the
power that has been fed into Rita during this approximate 20-hour period.
The answer turns out to be something on the order of tens of thousands of
1-GigaWatt nuclear power stations running at their full power output!
These images show her inexorable march towards the Texas coast.
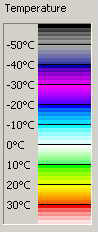
The color key for the thermal images is at the bottom of the page.
Click on the image(s) below for a higher-resolution (~100k) picture.
|
Wednesday, September 21, midday |
Thursday, September 22, early morning |
|
|
|
 |
 |
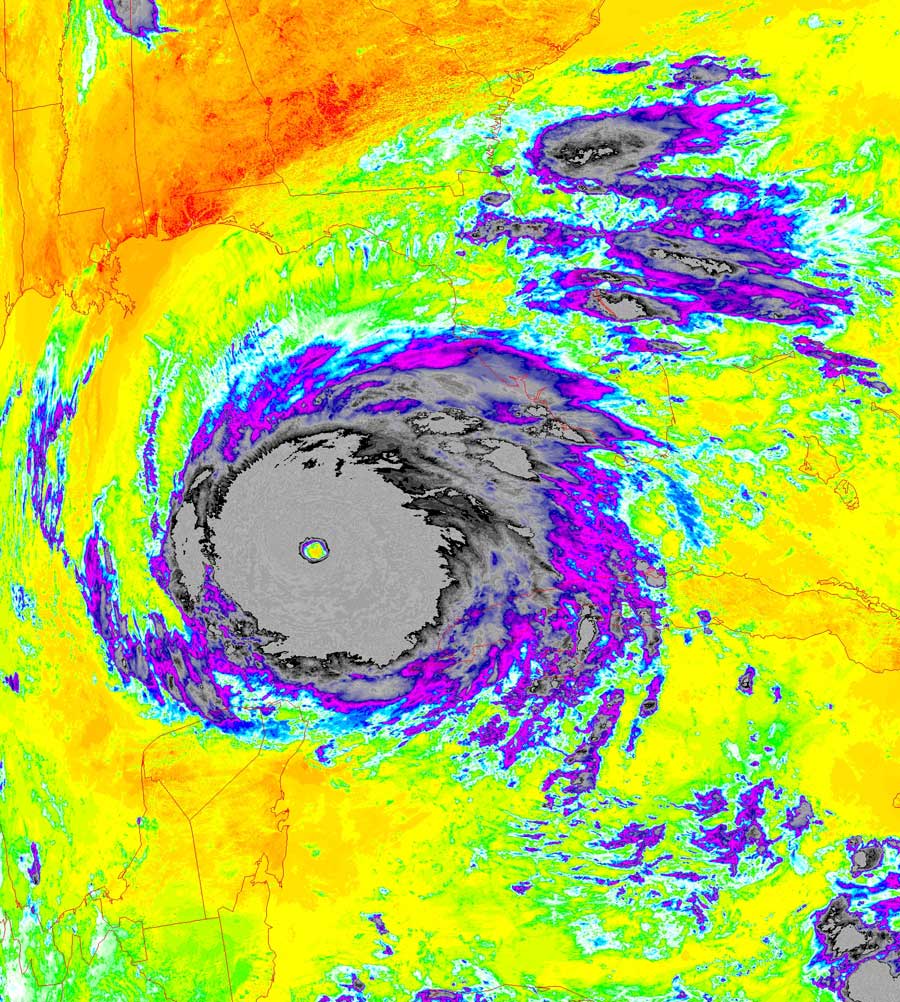 |
For perspective, note that water freezes at 00C (320F), 200C
is the same as 680F, and that -400C is the same
temperature as -400F. |