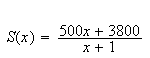
At a clothing store, daily sales of shirts (in dollars) after x days of newspapers ads are give by
-
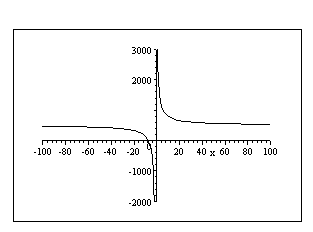
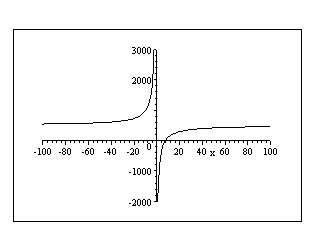
determine which of the following graphs will represent the graph of


-
Solve for
 algebraically.
-
Assuming that the ads keep running, will sales tend to level off?
-
What is the minimum amount of sales to be expected? What feature of the graph gives this information?
-
If newspaper ads cost
 per day, at what point should they be discontinued? Why?
Find the vertical and horizontal aysmptotes for the following functions:

Find a rational function
![]()
 which satisfies all the following conditions:
-
 has vertical asymptotes at
 and
and

-
 has a horizontal asymptote at

-

-
the function
 (
(
 approaches to positive infinity) as
 (when
(when
 approaches to
 from the right)
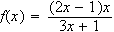
Let
![]()
-
Find the vertical and the horizontal asymptotes for

-
Find the intervals where
 and the intervals where

-
Graph
